The Signal the Market Chose to Ignore
Riccardo Alberti
A weekly institutional brief on the inflation signal markets chose to look through: May PCE, supercore services pressure, duration repricing risk, rate-sensitive exposures and the key macro catalysts for the week ahead.

W H Y T H I S W E E K M A T T E R S
If you own bonds, technology and growth shares, property funds or utility stocks, read this one closely. On Friday the US released its main inflation report, and buried inside it was a figure the market shrugged off. We think that was a mistake. When this particular figure has jumped in the past, the price of borrowing has tended to follow, and that is the kind of move that hits exactly the assets most ordinary investors hold. We are not forecasting that the Fed raises rates in September. We are saying the distance between what the data is now telling us and what markets are betting on has grown too large to ignore, and being caught on the wrong side of it costs far more than being caught on the right side gains.
This brief sets out what happened, why it matters for the things you most likely own, and what we would do in response
EXECUTIVE SUMMARY
The two inflation figures everyone watches, the headline number and the core number, both came in roughly where economists expected, and markets rose in relief. But underneath sat a third measure that matters more for where interest rates go next. It tracks the price of everyday services, things like insurance, medical care and air travel, stripped of the noisy bits (housing and energy). That measure jumped to +0.50% in a single month, up from +0.10% the month before. It is the second-largest monthly rise since the pandemic, and at that pace it simply does not fit with a central bank that leaves rates untouched for the rest of the year.
What follows from that is straightforward. Government bonds, housebuilders, property funds, utilities and the whole crowd of richly valued growth shares are all priced as if the Fed is done raising rates. If this services figure stays high for even one more month, that assumption has to be repriced, and the assets above are the ones that move. The cleanest way to position for that is an instrument called TBT, an exchange-traded fund that rises when long-dated US government bonds fall. It is built to move roughly twice as fast as the bond market, in the opposite direction.
Our own market-stress gauge, the Turbulence Index, is calm right now, which means investors are relaxed and the strain has not yet surfaced anywhere. At the same time, one of our timing tools flagged that the US stock market ran out of upward momentum at its early-June high of 7,625 on the S&P 500, with the first level worth watching on any pullback around 7,108. So shares are sitting near record highs, nervousness is low, and the most uncomfortable inflation figure of the year has not yet shown up in what markets expect from interest rates. That combination is precisely the setup where a small adjustment can turn into a large one in a hurry.
Where we stand: we would hold TBT at today's levels, in a modest size, because its built-in leverage cuts both ways. Friday's US jobs report is the first scheduled test of whether this plays out.
A note on the names used in this brief. TBT and TLT are funds that track US government bonds (TBT rises when bond prices fall, TLT rises when they climb). ITB tracks US housebuilders, VNQ tracks listed property, XLU tracks utility companies, HMB SS is the Swedish retailer H&M and DG is the US discount chain Dollar General. PCE is the inflation measure the US Federal Reserve watches most closely.
01 THE SIGNAL THE MARKET CHOSE TO IGNORE
Bonds look mispriced for the inflation we are actually seeing
The two figures the market reacts to behaved themselves. The headline rate came in at +0.4% for the month, a touch below the +0.5% expected, and the core rate (which excludes food and energy) was +0.32%, bang in line. Bond yields edged down and US shares pushed to new session highs. So far, nothing to see.
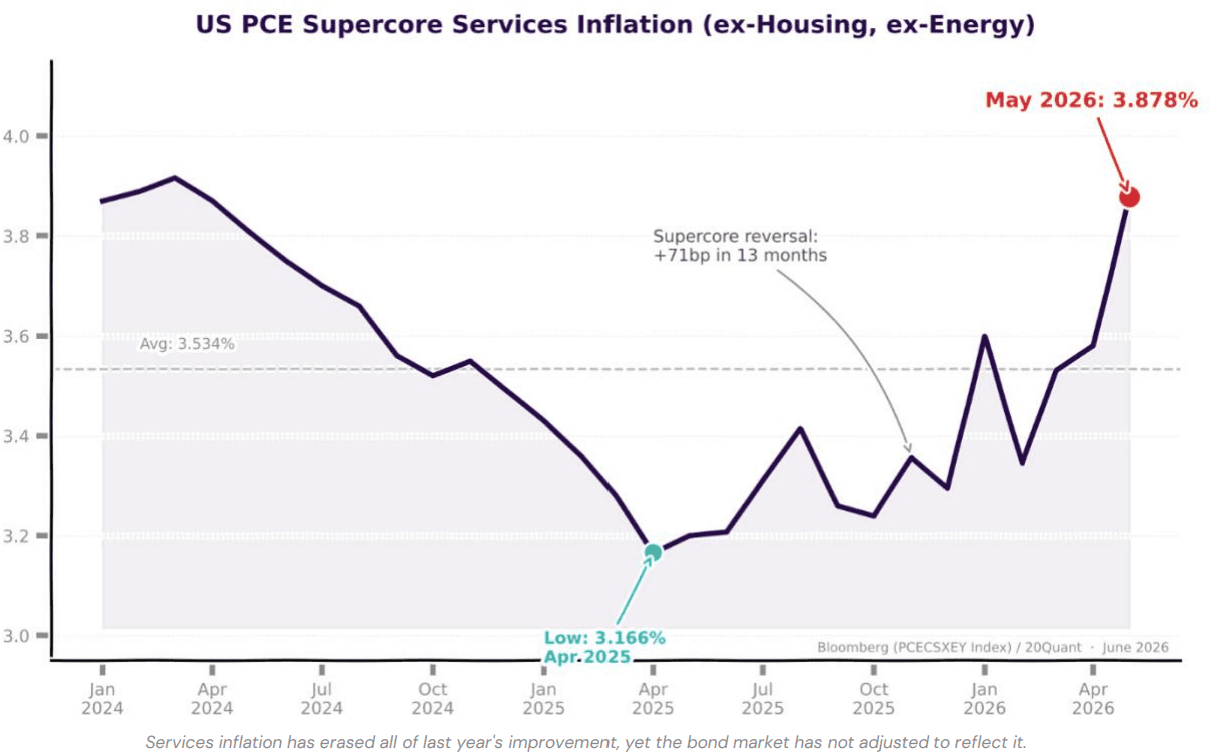
The third measure went the other way. The services figure climbed to 3.878% over the past year, erasing the entire improvement seen since early 2025 and reaching its highest level since March 2024. Why this matters: this is the gauge the Fed chair himself singled out, back in 2022, as the truest test of whether services inflation is becoming entrenched. It deliberately leaves out housing (which lags reality) and energy (which swings around). When it speeds up, the Fed takes notice. This week, the market did not.
Services inflation has erased all of last year's improvement, yet the bond market has not adjusted to reflect it.
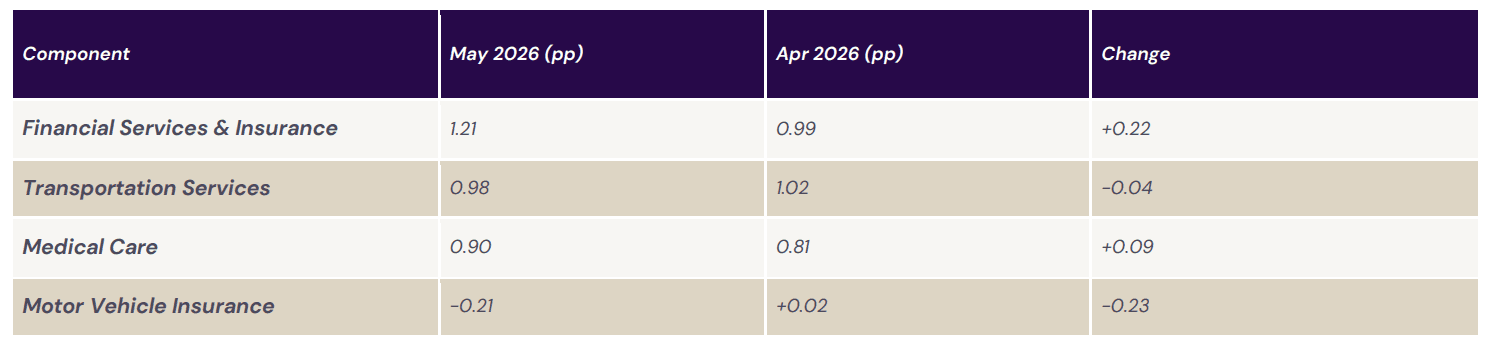
Look at where the increase is coming from and it is clearly home-grown, not imported. Financial services and insurance added the most of any category over the past year, 1.21 percentage points, the largest single contribution on record. Travel added 0.98 points, driven mainly by airfares. Medical care added 0.90. The one big offset is car insurance, which has dropped sharply from its 2024 peak. That decline is flattering the overall figure and disguising how fast the other categories are still climbing.
Why the breakdown matters more than the top-line number. Inflation caused by expensive oil goes away when oil gets cheaper. Inflation in goods goes away when supply chains heal. But rising prices for healthcare, flights and financial services come from steady demand at home, and a falling oil price does nothing to cool them. That is the kind of inflation a central bank cannot look past, and it is exactly the kind the market is choosing to look past this week.
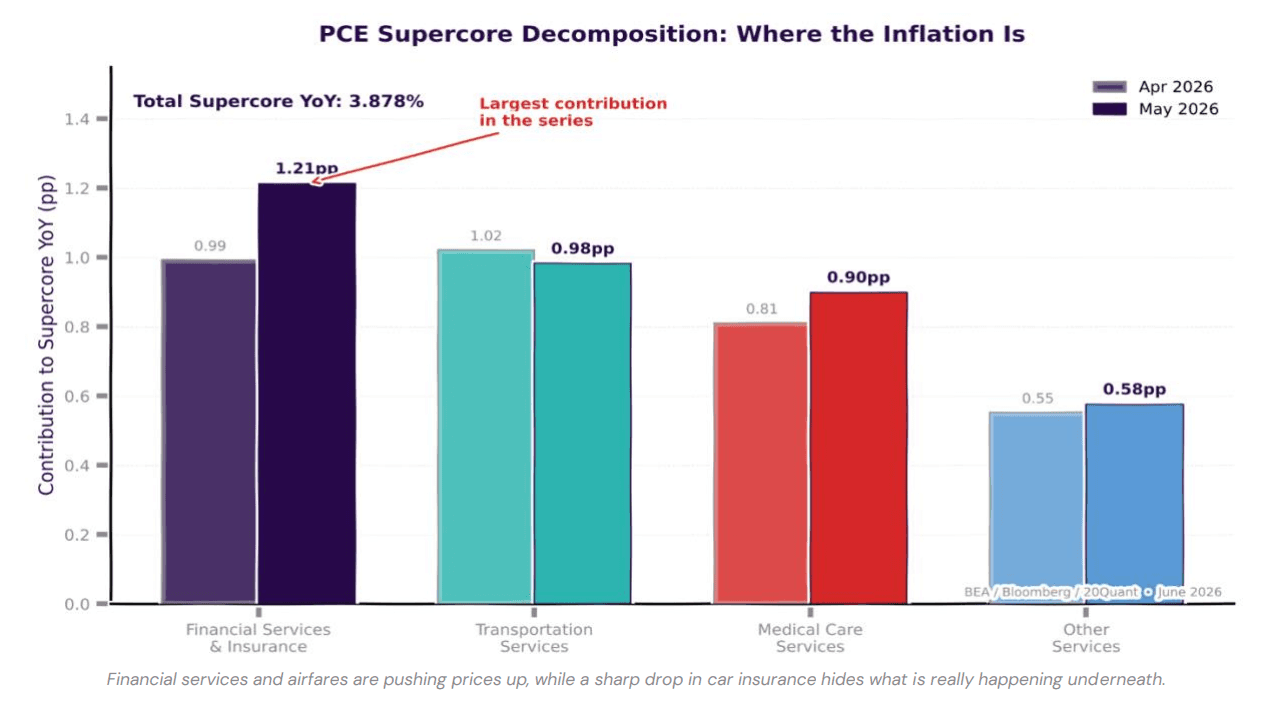
Financial services and airfares are pushing prices up, while a sharp drop in car insurance hides what is really happening underneath.
The wider economic picture is mixed. Household incomes rose a strong 0.7% (against 0.4% expected) and spending held up, yet new home sales dropped 7.3%. A widely followed real-time growth estimate has eased to 2.54% from 3.04%. In short: demand is still firm, but the parts of the economy most sensitive to interest rates are beginning to feel the strain.
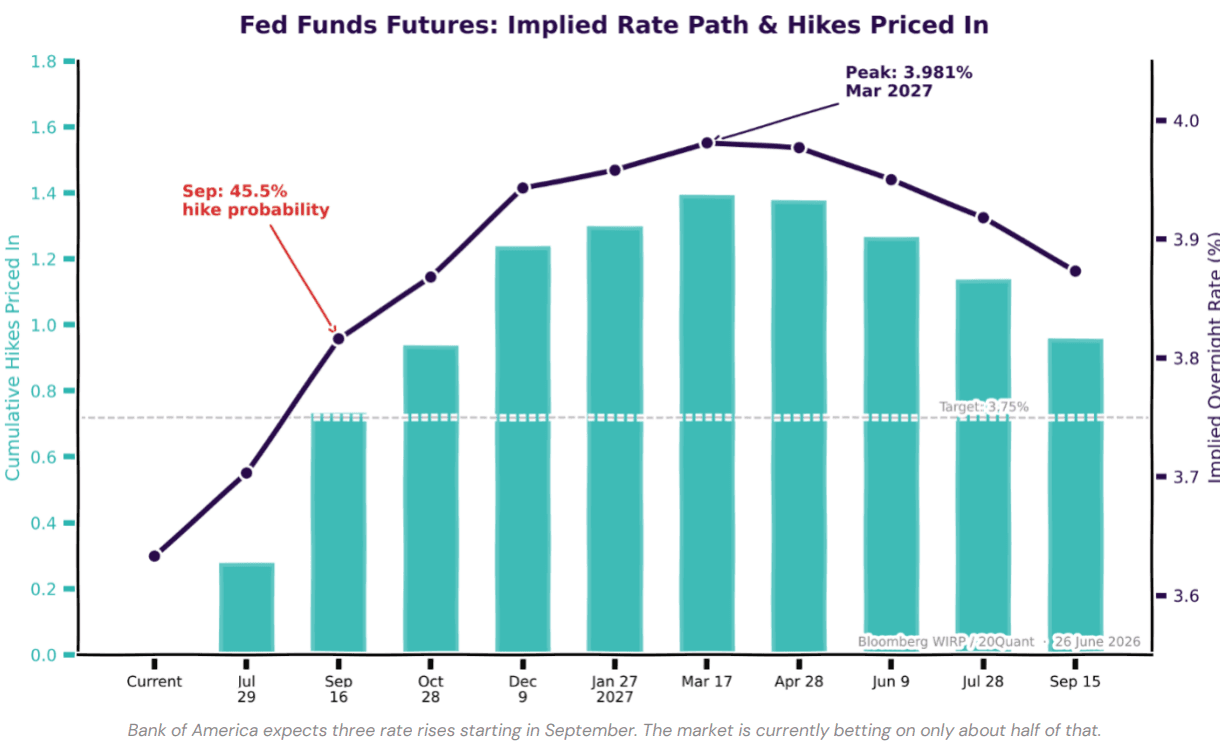
What this means for how you are positioned. Markets are currently betting on roughly one and a half rate cuts over the coming year. If services inflation prints another +0.4% to +0.5% in June, that bet falls apart. Bank of America's analysts have gone further and now expect three rate rises starting in September. We are not signing up to that exact call. The point is simpler: the gap between what markets expect and what the data is showing has grown so wide that almost any move closes it, and it is far more likely to close in one direction than the other.
02 STOCKS OF THE WEEK
One position to act on, and six names that tell us if we are right
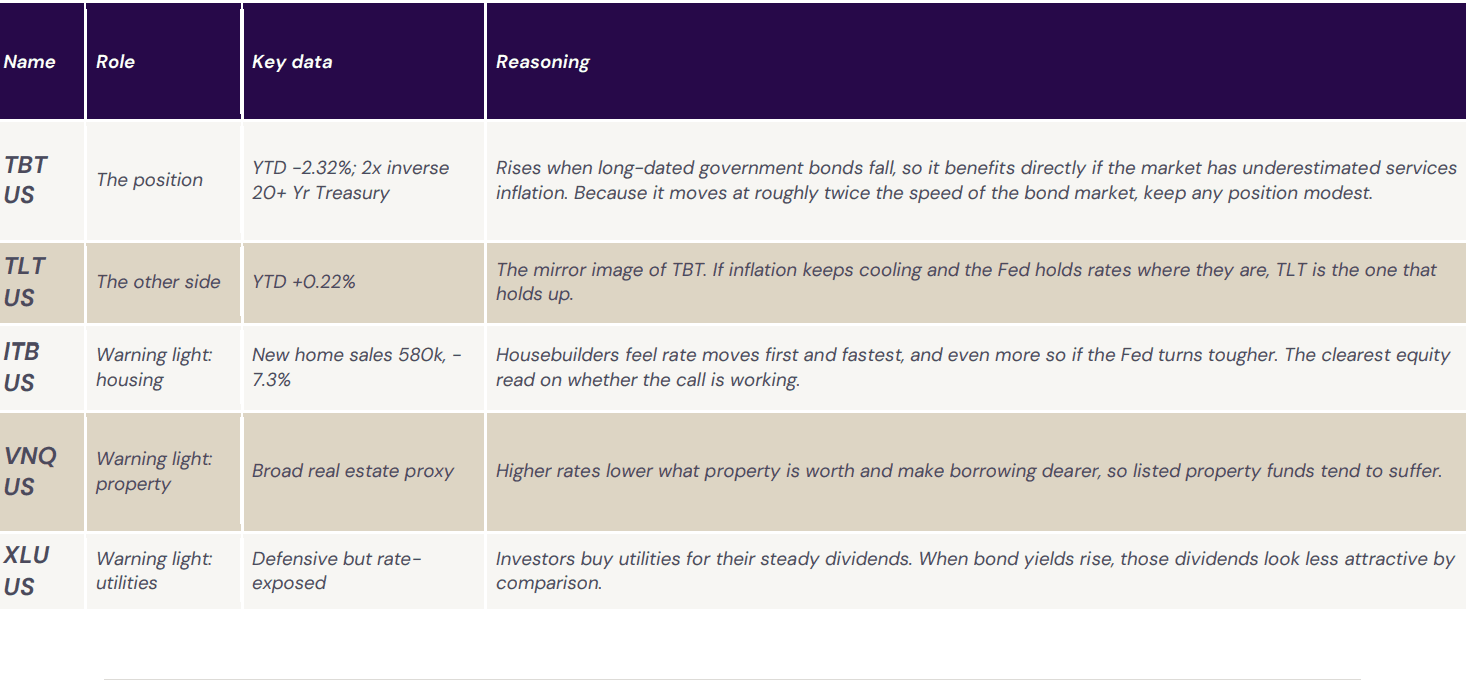
Read the table below in three layers. TBT is the one to act on. TLT is its opposite, the position we would lean on if we turn out to be wrong. The other five names are not trades at all. They are early-warning lights: we watch them to see, in real time, whether our view is playing out in the corners of the market most exposed to rising rates. If the housebuilders and property funds start to slide while the retailers show the consumer cracking, that tells us the call is working.
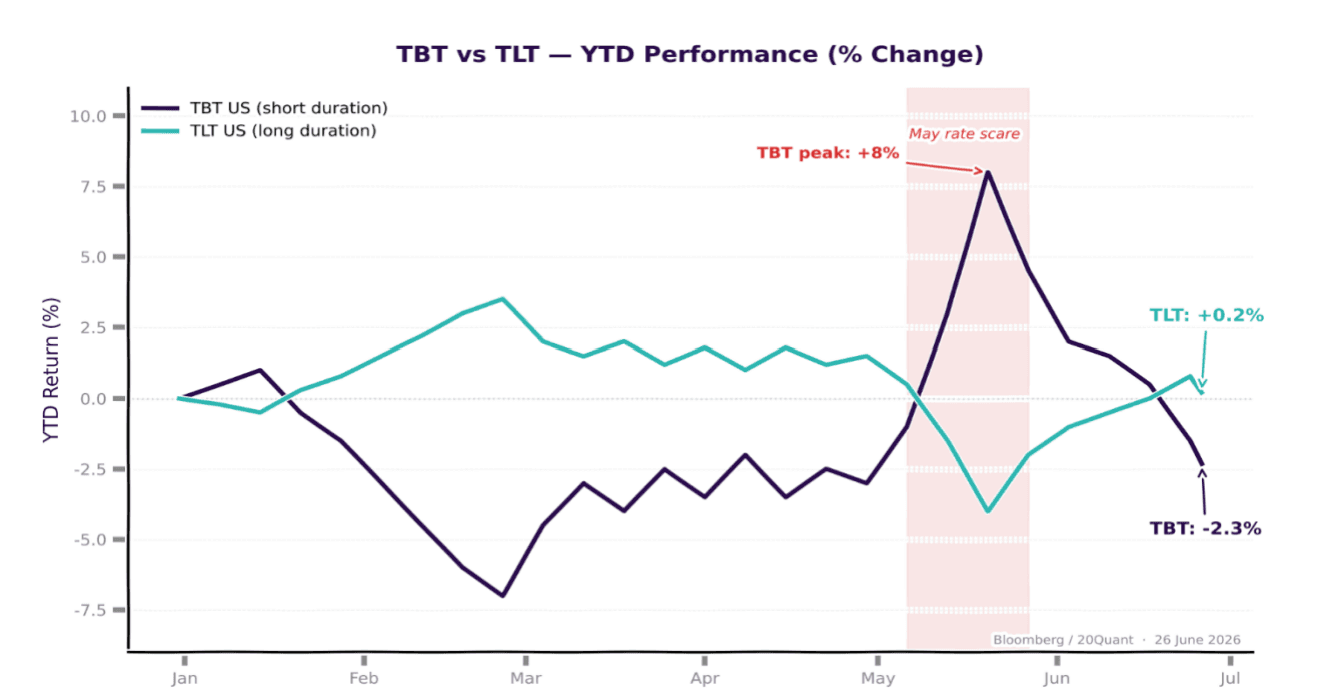
TBT jumped 8% in May when rate fears flared, then gave it all back. A useful reminder of how sharply it moves when worries about services inflation resurface.

03 TURBULENCE INDEX
What our stress gauge is telling us, and what it is not
The Turbulence Index is our measure of how much strain is building across markets. In plain terms, it watches thirteen different types of investment and asks whether they are behaving normally together or starting to move in strange, out-of-character ways. (For the technically minded, it does this using a statistical method called Mahalanobis distance.) When the normal relationships break down, that is usually an early sign of trouble.
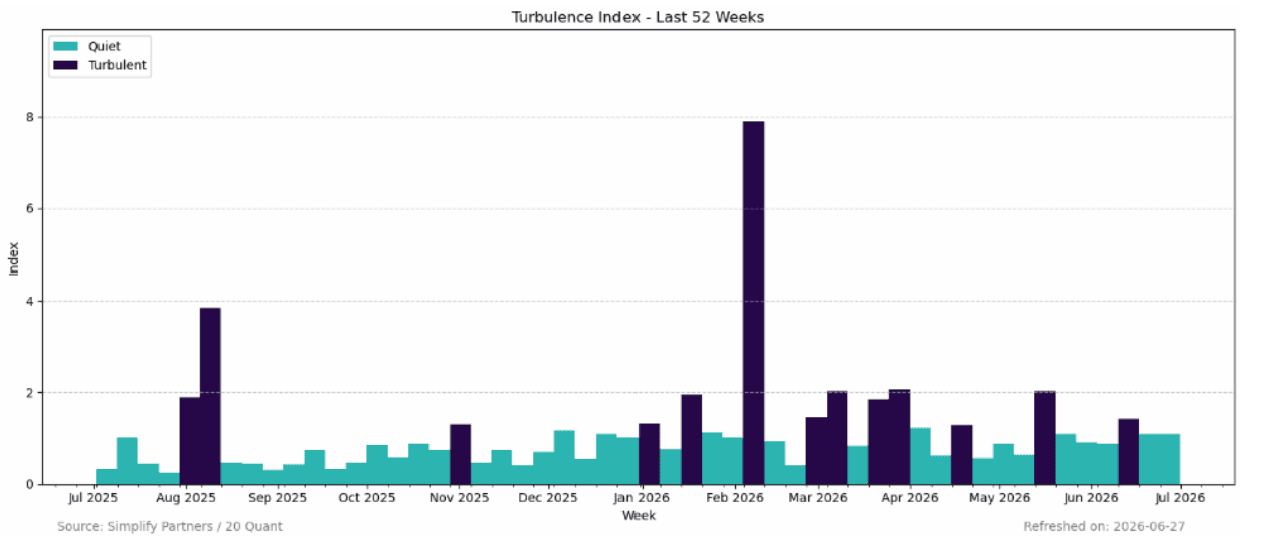
Current regime: Quiet
The Turbulence Index is currently Quiet. Markets are behaving normally and there is no sign of strain at the overall level.
Why calm is not the same as safe. A calm reading tells us how investors are positioned today, not what is heading their way. Right now they are positioned for an easy ride: low nervousness, cheap insurance against trouble, high share prices and big bets on bonds. That is precisely the line-up that gets hurt if services inflation keeps running at +0.5%. The calm is what makes the opportunity possible, not a reason to dismiss it.
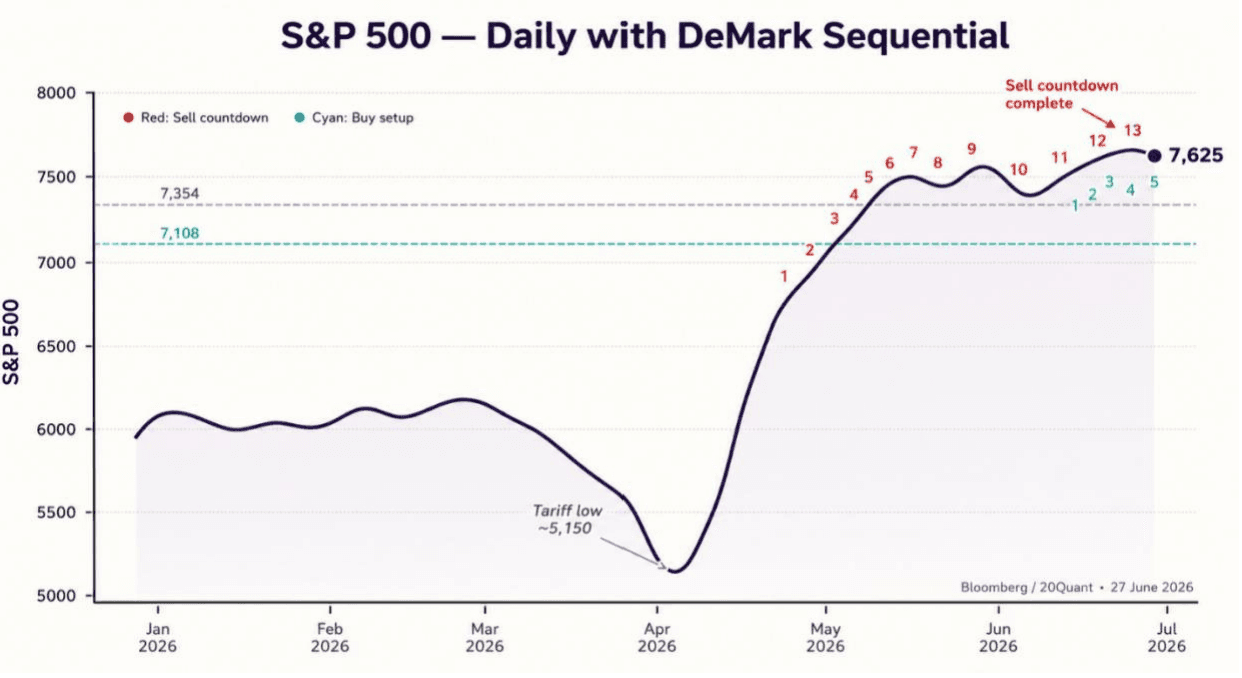
One of our timing tools has also flagged that the US stock market ran out of upward steam at its early-June peak of 7,625 on the S&P 500, a classic sign that a rally is tiring. The same tool is starting to hint at a possible turn back up after the recent dip, but that reading is only about halfway formed and too early to lean on.
What this means for the week's theme
Three things are true at once. Markets are calm. The stock-market rally is running out of energy at its highs. And bond markets still have not absorbed the hot services inflation figure. When those three line up, the maths is lopsided: if inflation does keep cooling, you gain only a little by being relaxed, but if it does not, the fall is sharp. That imbalance, small upside against large downside, is the whole reason for the position.
04 WRAP-UP: NEXT WEEK
What to watch next week

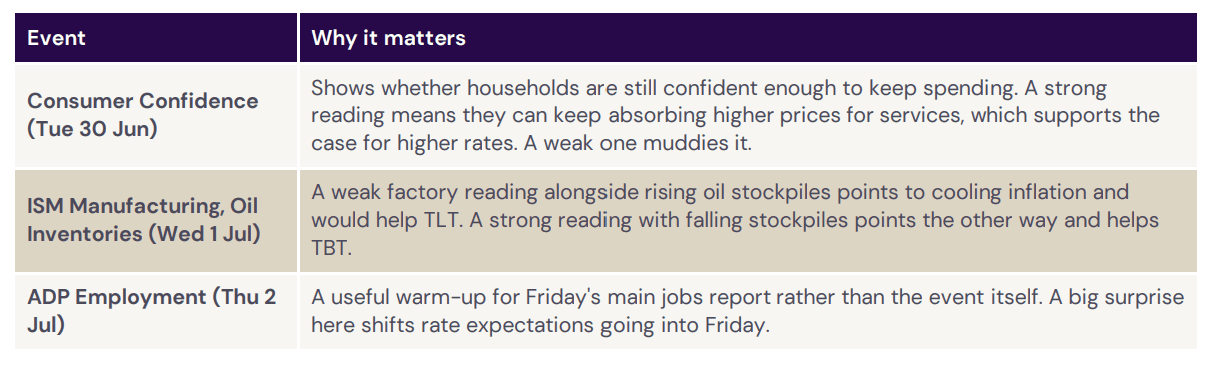
Next week brings a run of releases that go straight to the heart of this view. Here is what each one tells you and which way it tips the argument.
Bank of America expects three rate rises starting in September. The market is currently betting on only about half of that.
05 CLOSING
In brief
We would hold TBT at today's levels, in a modest size given the way its leverage cuts both ways. Our timing tool, which has flagged that the stock-market rally is running out of steam, adds to the case for acting now. Shares are near record highs, our stress gauge is calm, insurance against a sell-off is cheap and bond prices are relaxed. Investors are positioned for inflation to keep falling, and May's hot services figure has not yet put that positioning to the test.
Two things would change our mind. The first would be a June services figure below +0.2% for the month, which would take the heat out of May's reading and give the bond rally firmer ground. The second would be a clearly weaker jobs report on Friday, which would push the Fed towards protecting growth and would make today's relaxed bond pricing look sensible rather than complacent.
Market Insights
Selected research notes on macro regimes, risk dynamics, and portfolio implications across market cycles.