Published on Jul 2, 2026
India Didn't Have a Small Cap Bubble. It Had a Fragility Problem.
Federico Polese

For most of 2024 and 2025, the loudest question in Indian markets was whether small and mid caps were a bubble. It was a fair question. The Nifty Smallcap 100 was trading at roughly a 50 percent premium to its long-run average, and the Midcap 100 sat well above its own history. Saurabh Mukherjea at Marcellus spent much of that period writing on quality and on the danger of paying any price for growth, and he was right to. Deepak Shenoy at Capitalmind kept returning to a plainer point, that valuations were stretched and the honest response was to stay invested with a long horizon rather than to guess the top. Shankar Nath built a methodical, data-first case for the same concern, walking a large retail audience through exactly how stretched the numbers had become and what that historically meant for forward returns.
We read all three. We do things differently, through models rather than conviction, but we read them closely because the valuation debate was the right debate to have. What we want to add is the part the valuation debate could not see.
Valuation tells you a market is expensive. It does not tell you when the expensive market breaks, or how hard. Those are different questions, and in India they had different answers.
The word “bubble” was doing too much work
By early 2026 the consensus had softened. After the 2025 consolidation, most analysts stopped calling the broad market an acute bubble. Large caps looked closer to fair. The froth, where it remained, was concentrated and selective. That was a reasonable read of the price level.
It was also incomplete, because it described the height of the market without describing its stability. A market can be moderately expensive and structurally sound. It can also be moderately expensive and structurally fragile. The two look identical on a price-to-earnings screen. They do not behave identically when a shock arrives.
Here is the detail that the valuation lens missed. Through late 2024 and 2025 the small cap indices barely moved, while the median stock inside them fell. The Nifty Smallcap 250 was close to flat off its October 2024 level, but the typical constituent was down. A handful of large names were holding the index up while breadth rotted underneath. That is not a valuation fact. It is a fragility fact, and it is exactly the kind of internal weakening that a price index is designed to hide.
What we actually measure
At 20Quant we have run analytical models live since 2008, through every major stress episode since. Three of them speak directly to the question India was asking.
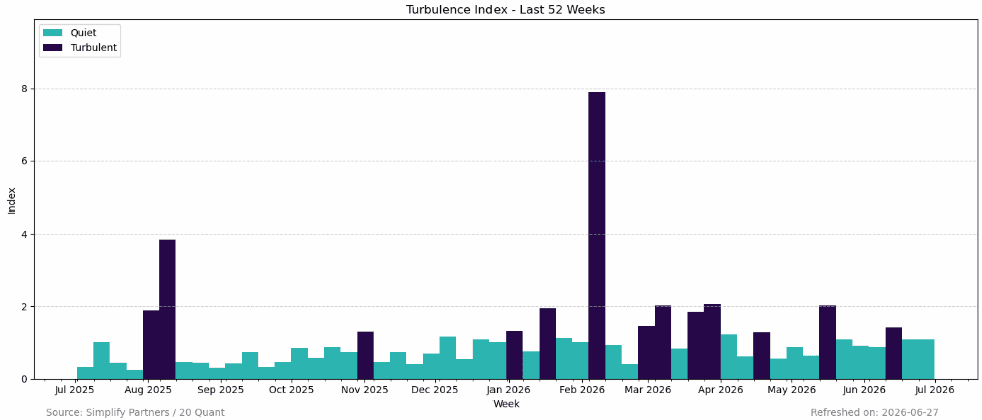
The first is our Turbulence Index. It does not read the level of the market. It reads how coordinated the moves inside the market have become. When assets that normally move independently start moving together, the market has become internally tense, and that tension shows up before the drawdown, not during it. A market can be turbulent while still rising, which is precisely the state that catches people out.
The second is LPPLS bubble detection. This is a structural approach, not a valuation one. It looks for the specific pattern of faster-than-exponential price growth accelerating toward an unstable point. The useful thing about it is that it separates a durable trend from a self-reinforcing one that is running out of room. A stock can be expensive and stable. It can also be expensive and mathematically unstable. LPPLS is built to tell those apart.
The third is our crash-probability work, the GSY model. It estimates the conditional probability of a large drawdown given the current structure of the market, rather than forecasting a date. It answers a question every family office actually asks, which is not “will the market fall” but “how exposed am I if it does.”
None of these is a valuation tool. That is the point. They read fragility, which is the variable that valuation leaves out, and fragility is what turned an expensive Indian market into a fast one in March.
March 2026, read structurally
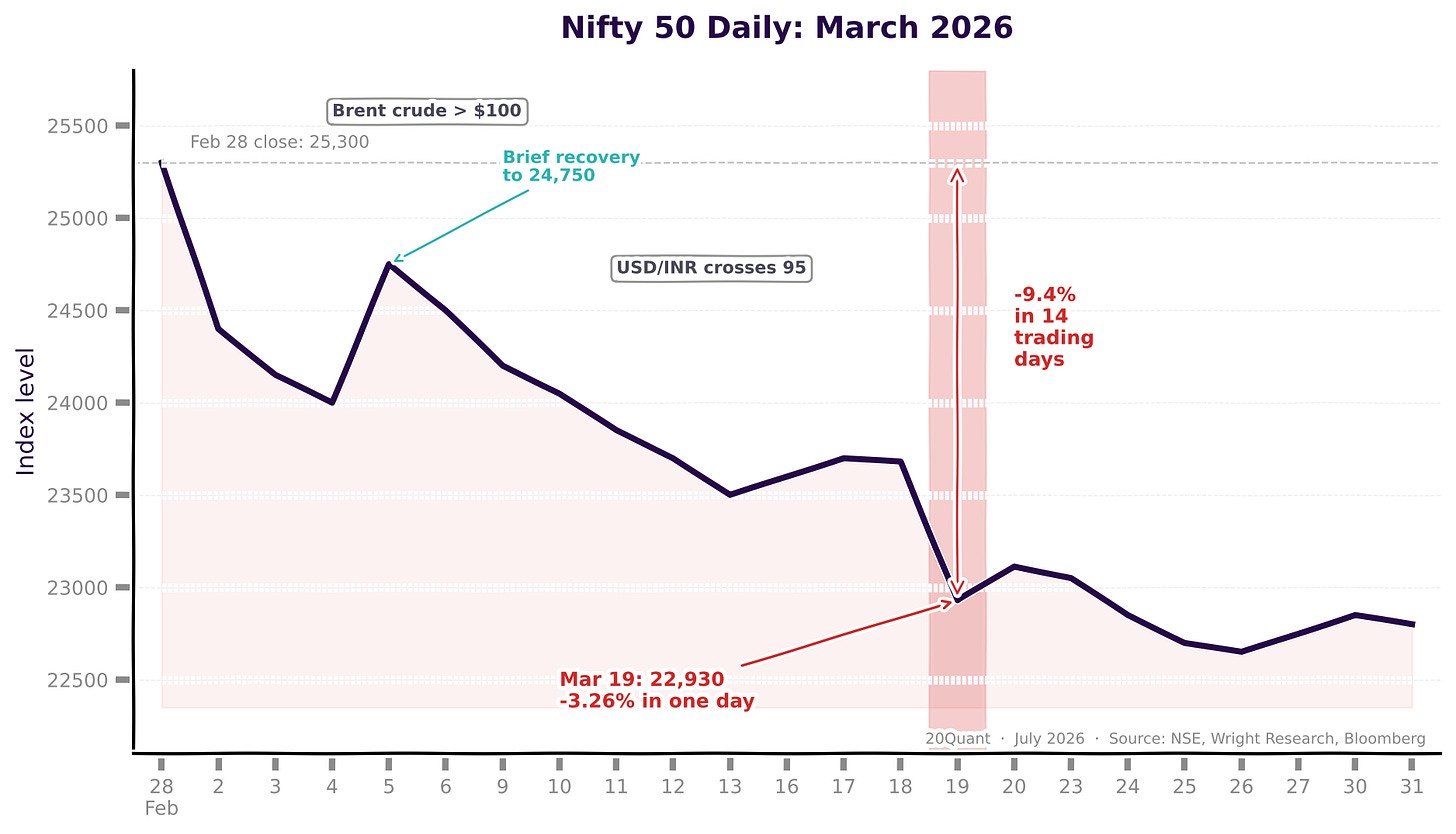
In March the Nifty fell about 10 percent, its steepest single month since the COVID shock of 2020. The trigger was external. Tension in West Asia pushed crude above 100 dollars, the rupee crossed 95 to the dollar, and foreign investors pulled more than 52,000 crore in the month, one of the largest monthly outflows on record.
It is tempting to file this under geopolitics and move on. Oil spiked, foreigners sold, the market fell. But the shock does not explain the speed. Plenty of markets absorbed the same oil move with a shrug. India moved fast because it was already internally tense. Breadth had been narrowing for over a year. A few names were carrying the indices. When the external shock arrived, there was very little underneath to cushion it, so the fall was quick and broad rather than slow and contained.
That is what fragility means in practice. The shock was the match. The dry structure underneath was the reason it spread. Valuation told you India was expensive. It did not tell you India was flammable. The internal reading did.
Pranay Kotasthane has written extensively on how Indian policy frameworks create their own forms of structural risk, from regulatory unpredictability to the kind of abrupt rule changes that repriced foreign capital after the Tiger Global ruling in January. The fragility we measure in price structure has a policy counterpart: when the legal treatment of treaty-routed capital gains can shift retroactively, foreign investors do not just reduce exposure because of valuation. They reduce exposure because the rules themselves have become less stable. That policy fragility and market fragility compounded each other in March, and any honest reading of the drawdown has to account for both.
There is a footnote worth keeping honest. Structural models are early far more often than they are late, and being early can look like being wrong for months. Anyone who read narrowing breadth as fragility through 2025 sat through a market that kept drifting up before it fell. We take that seriously and we say so plainly. A model that reads fragility is a tool for sizing risk and preparing, not a stopwatch for calling the day.
Where this leaves an Indian HNW investor
The correction did some work for you. It brought the Nifty back to a price-to-earnings ratio near 19, which is a far more reasonable starting point than the market offered a year ago. Domestic institutions, now the largest owners of the Nifty 500 for the first time, absorbed much of the foreign selling, which is a genuine structural change in who sets Indian prices. Capital Letters by Angel One recently traced this shift in detail: roughly ₹30,000 crore of SIP capital flows into mutual funds every month regardless of what is happening globally, and that recurring bid is what gave domestic institutions the firepower to hold the market when foreign funds were running.
But the lesson of March is not “the correction is over, buy.” The lesson is that the risk in your portfolio was never fully described by how expensive it looked. It was described by how fragile it was underneath, and that is a different measurement that most private investors never get to see.
This is the first post in a series written for Indian investors who want that second measurement. Over the coming weeks we will apply the same structural lens to the questions actually on the table for HNW portfolios in India right now. The gap between the 13 to 18 percent gross yields advertised on private credit and what reaches the investor. How to read a bank’s credit quality before the re-rating rather than after. And the currency and diversification question that a rupee near 94 forces every family office to answer, which is how to take global exposure without betting against India.
We will keep reading the writers worth reading on these subjects, from Anirudha Basak on Indian credit to Shrishti Sahu on how family offices allocate. And we will keep adding the one thing a firm that has run these models live since 2008 can add, which is a reading of fragility that price alone will never give you.
If that is useful, subscribe. The next post looks at what the March drawdown looked like two weeks before it arrived.
This document has been prepared solely for informational, educational, analytical and research purposes.
This document is not intended to constitute, and should not be construed as, investment advice, investment recommendation, research analyst services, portfolio management services, investment advisory services, securities research services or any other regulated activity under applicable laws and regulations of India, including those administered by the Securities and Exchange Board of India (“SEBI”).
The contents of this document are general in nature and do not take into account the investment objectives, financial situation, risk profile or particular requirements of any person. Recipients should not rely upon this document as the primary basis for making any investment decision and should obtain independent professional advice before making any investment, financial, legal, tax or other decision.
Any references to securities, issuers, sectors, industries, markets, indices, ETFs, model outputs, rankings, probability estimates, risk assessments, screening results or quantitative indicators are provided solely for analytical and educational purposes. Such references do not constitute a recommendation, endorsement, offer, solicitation or invitation to buy, sell, hold or otherwise transact in any financial instrument or investment product.
20Quant S.r.l. is not registered with SEBI as an investment adviser, research analyst, portfolio manager or intermediary and does not hold itself out as providing regulated securities services in India through this publication. Recipients located in India are solely responsible for ensuring that their access to and use of this document complies with applicable Indian laws and regulations.
© 2026 20Quant S.r.l. All rights reserved.
Piazza San Marco 1, 20121 Milan, Italy