Published on Apr 10, 2026
The Compounders Inflation Cannot Reach
Federico Polese

01 — The Regime
The debate moved on. The problem did not.
In 2022, investors argued about whether inflation was transitory. In 2025, the argument shifted to whether central banks had finished hiking. Both debates missed the more consequential question: whether the macroeconomic regime itself has changed.
The evidence increasingly suggests it has. The supply shocks accumulating since 2020 share a structural characteristic with the 1970s. They are not demand-pulled. They are cost-pushed, persistent, and partially non-linear. Logistics fragmentation, energy re-pricing, the reversal of Chinese goods deflation, and a growing geopolitical risk premium building into commodity markets: these are supply-side forces. They do not respond to rate hikes the way excess aggregate demand does.
The policy consequence is an environment where rates stay elevated and input costs stay high simultaneously. That combination does not punish all businesses equally. It redistributes economic value. The primary analytical task is identifying which businesses sit on which side of that redistribution.
"Supply-side inflation does not destroy all equity value. It redistributes it. Most sector labels point in the wrong direction. The right screen operates at the level of the individual business."
02 — The Metric
What ROIC actually measures, and why sector labels mislead.
Return on Invested Capital (ROIC) is calculated as Net Operating Profit After Tax divided by total invested capital: fixed assets plus net working capital. It measures the economic productivity of capital — how many cents of after-tax operating profit the business generates for every dollar tied up in operations.
Most investors use it as a quality filter. It is more fundamental than that.
In an inflationary environment, businesses face the obvious pressure: input costs rise, margins are tested. What most analyses stop short of capturing is the second-order effect. Inflation forces companies to deploy more nominal capital simply to sustain the same real output. Inventory is replenished at higher prices. Receivables inflate in line with higher nominal revenues. Replacement capex grows as equipment costs more. The treadmill accelerates.
A business earning 8% ROIC in a 5% inflation environment is generating a real capital surplus close to zero. Nominal earnings can look stable while real value erodes. A business earning 50%+ ROIC operates on different terms. The surplus above cost of capital is large enough that even as nominal capital requirements grow with inflation, the business generates substantially more than it needs to reinvest. And when genuine pricing power accompanies that ROIC, the mechanism becomes self-reinforcing: price increases flow to operating profit with minimal additional capital required.
03 — The Validation Step
CF-ROIC: confirming the number is real.
Traditional ROIC uses Net Operating Profit After Tax as the numerator. NOPAT is an accounting construct. It is subject to depreciation conventions, the amortisation of acquired intangibles, revenue recognition timing, and working capital accruals. A company can report strong NOPAT-based ROIC while generating materially less in actual cash. The gap between the two is, in effect, a measure of earnings quality.
Cash Flow ROIC (CF-ROIC) replaces NOPAT with free cash flow: operating cash flow minus capital expenditure. It strips out accounting distortions and asks a simpler question: what does the business actually generate in cash for every dollar of capital deployed?
Why CF-ROIC matters in an inflationary context
In a rising-price environment, the gap between accounting earnings and cash earnings widens for capital-intensive businesses. Higher replacement capex, working capital build, and cost inflation absorbed through the income statement before hitting cash flow can all cause NOPAT to overstate real economic returns. CF-ROIC surfaces this divergence immediately.
The cross-validation rule is simple. When CF-ROIC is close to or above accounting ROIC, earnings quality is confirmed: the business converts its profits to cash at a high rate. When CF-ROIC is substantially below accounting ROIC, the accounting earnings contain accruals that have not yet become cash, and the ROIC figure should be treated with scepticism.
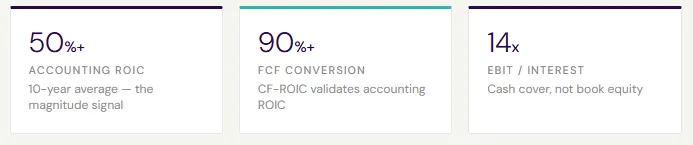
The company examined in this issue shows FCF conversion above 90%, meaning CF-ROIC validates rather than contradicts the accounting ROIC. The earnings are real. The cash is real. This convergence is the most important confirmatory signal in the analysis.
When screening for high-ROIC compounders in an inflation regime, require both: accounting ROIC sustained above 50% for a minimum of five years, and FCF conversion above 80%. Businesses that pass both tests are rare. They are also precisely the businesses where the inflation treadmill has the least grip.
04 — The Mathematics
Compounding is arithmetic, not luck. Eighteen years of data confirm it.
The connection between ROIC and long-run stock price performance is not narrative. It is precise.
A business earning 50% ROIC and reinvesting 50% of earnings back into the business grows its intrinsic value at approximately 25% per year in nominal terms (ROIC multiplied by the reinvestment rate). A business earning 8% ROIC with the same reinvestment fraction grows intrinsic value at roughly 4%. Over a decade, the gap is not linear. It is exponential.
The chart below shows the growth of $100 invested in April 2008 across four series, all calculated on an identical basis using Bloomberg total return data through April 2026.
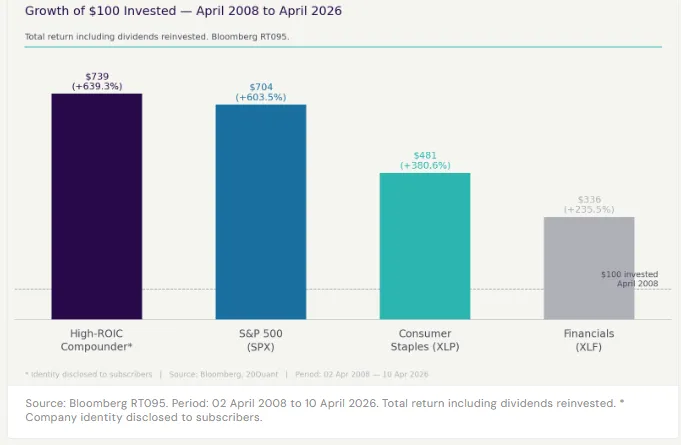
The result that demands attention is not the outperformance versus the S&P 500 (+36 percentage points over 18 years). It is the outperformance versus the Consumer Staples sector (+259 percentage points). The conventional inflation-hedge allocation — buy staples, buy defensives — returned $481 on a $100 investment. The high-ROIC business within that universe returned $739. The sector label and the ROIC screen are not the same thing. They pointed to materially different outcomes.
"Investors who bought the sector as an inflation hedge got 381%. Investors who applied the ROIC lens within that sector got 639%. The difference is not alpha. It is analytical precision."
The error most investors make is comparing a 50%-ROIC compounder to a 9%-ROIC business on an equivalent P/E basis and concluding the former is overvalued. The multiple reflects the present value of compounding that structurally lower-ROIC businesses cannot produce. It is not a premium. It is a correct price for a different quality of asset.
05 — The Mechanism
Why capital efficiency is the real inflation hedge.
The standard inflation-hedge argument for capital-efficient businesses focuses on addictive or habitual demand and demonstrated pricing power. Both are correct. They are also surface-level.
The deeper mechanism is the cost structure of incremental revenue. In the company we examine, the core products are capital-light consumables where the dominant cost of production was incurred at the point of manufacturing scale, not at the point of each additional unit or each price increase. The incremental invested capital required to raise price is approximately zero. No new facilities. No material increase in headcount. No proportionate working capital build. The price increase converts almost entirely to operating profit.
This is the precise property that makes 50%+ ROIC businesses the structurally correct allocation in a persistent inflation regime. They pass through price increases and capture the full operating leverage of the price-cost spread without tying up additional capital to do so. The treadmill that extracts real value from capital-intensive, low-ROIC businesses simply does not accelerate for them.
The 18-year unbroken dividend growth record, compounding at 7.1% per year in nominal terms, is a second-order consequence of the same mechanism. A 220% increase in the nominal dividend over 18 years is not financial engineering. It is what happens when a business earns 50%+ ROIC consistently and distributes the surplus.
06 — The Screen
Where else this architecture exists.
The company examined in this issue is a case study. The underlying framework applies across sectors and geographies. The observable characteristics of businesses that share this structural position:
Category leadership with structural switching costs or regulatory barriers that effectively preclude new entrants. Demand that is recurring and habitual rather than discretionary. A pricing history showing consistent real price growth (above relevant CPI) across at least one full economic cycle. Capital intensity — capex to revenue, net working capital to sales — that is low relative to operating margins.
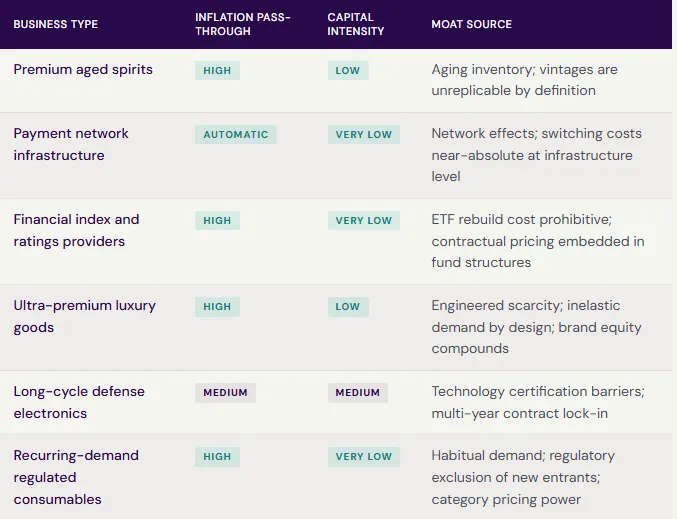
Which specific businesses in each category currently pass the full 6-step ROIC screen?
In the subscriber edition: the company behind this issue's case study is identified, with full valuation and entry-point analysis. Each category in the table above is mapped to specific securities with current ROIC data, CF-ROIC validation, pricing history, and 20Quant factor model scores.
07 — The Framework
The analytical sequence.
The inflationary regime does not require heroic macro calls to navigate. It requires a structured identification process applied at the level of individual businesses, not sectors.
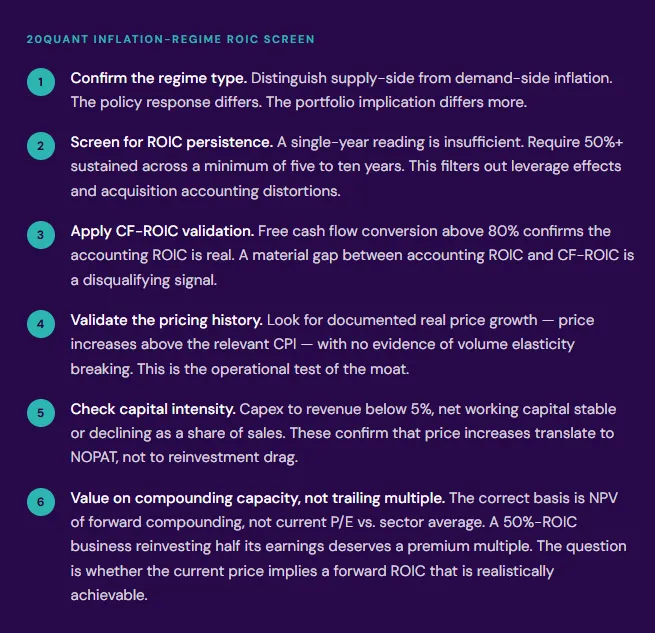
The businesses that pass all six tests are rare. The eighteen-year Bloomberg return data confirms that rarity has a price: investors who applied equivalent discipline — reaching for the ROIC screen rather than the sector label — captured returns that the conventional defensive allocation could not approach.
The regime does not reward sector rotation. It rewards analytical precision applied at the level of individual business economics.
This content is produced by 20Quant for informational and research purposes only. It does not constitute investment advice or a solicitation to buy or sell any security. Performance data sourced from Bloomberg RT095 total return series (identical start date: 02 April 2008; end date: 10 April 2026). ROIC and financial metrics sourced from company disclosures and Bloomberg. Past performance is not indicative of future results. Investors should conduct their own due diligence and consider their specific investment objectives and risk tolerance.
20Quant · The architecture of disciplined investing. · 20quant.eu


